collectrics
born from passion for the hobby
...and from desperation / necessity

science meets nostalgic obsession

As a Pokemon obsessed collector, me and my kids love to rip and open packs. But we quickly learned that sometimes bad luck can hit OFTEN and HARD. What are your actual odds when opening packs? Well, it turns out the odds, otherwise known as "pull rates" were widely available and generally considered very reliable.

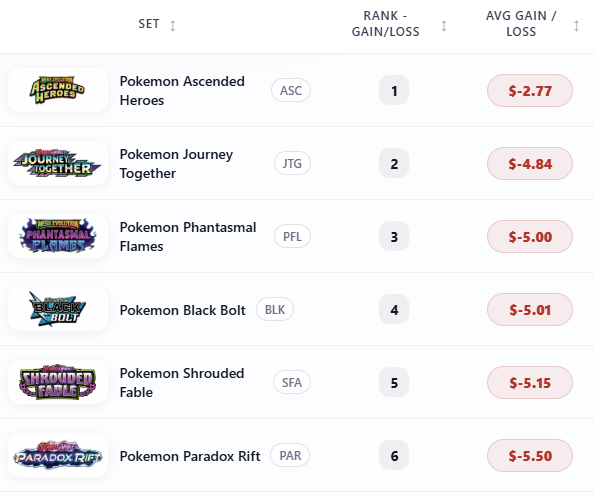
So, as a data analyst by trade, I couldn't help but crunch some numbers, including 
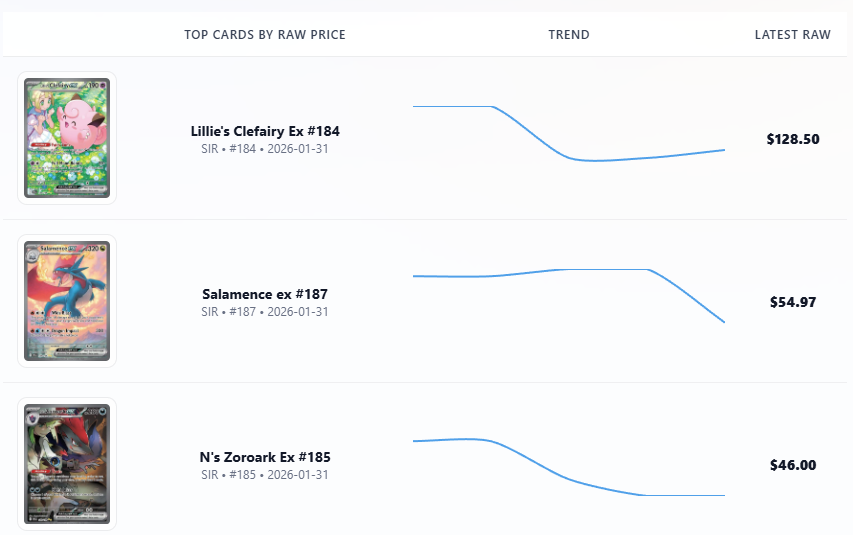
market prices of cards, combined with pull rates to see which sets had better odds, and which sets were AWFUL. Thus began a journey that started with moving some numbers around in a spreadsheet, to 
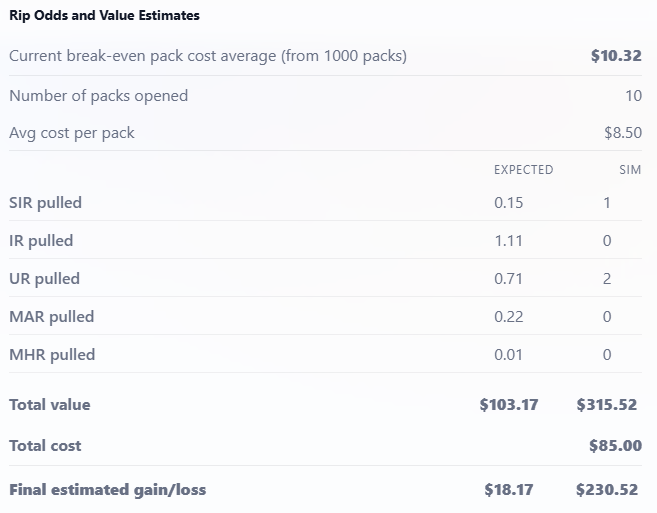
a much broader, more aspirational idea. What if I built a tool that I can use to run these numbers and it update every day autmoatically? And... what if I shared it with the world??

was born.

Day Family Project on YouTube

Just a few months ago, I started my YouTube journey for Pokemon content. I'm still very new, but looking to provide more positivity and, in my opinion, much needed analytics to the space.
current set value leaderboard
Leaderboard example
See how sets stack up by expected raw value per pack. We combine pull odds and average card values (by rarity tier) into a single EV number so you can compare sets fast. With pack cost, you’ll also get an “average gain/loss” view to separate hype from math.
set value and card price trends
Cards detail example
Explore set-level EV history and drill down into cards. Great for seeing whether a set is heating up, cooling off, or just doing the classic “why did I buy this” wiggle.
pack rip odds and estimated value calculator
Calculator example
Pick a set, enter packs opened and cost per pack, and get clear estimates for expected pulls and expected value. Compare the “average” outcome against randomized results that feel closer to real ripping sessions.
pack ripping simulator — coming soon
Thumbnail (coming soon)
Run full ripping sessions with realistic variance — simulate 1 session or 1,000 sessions, compare outcomes, and see how often you end up ahead (or in the “learning experience” zone).